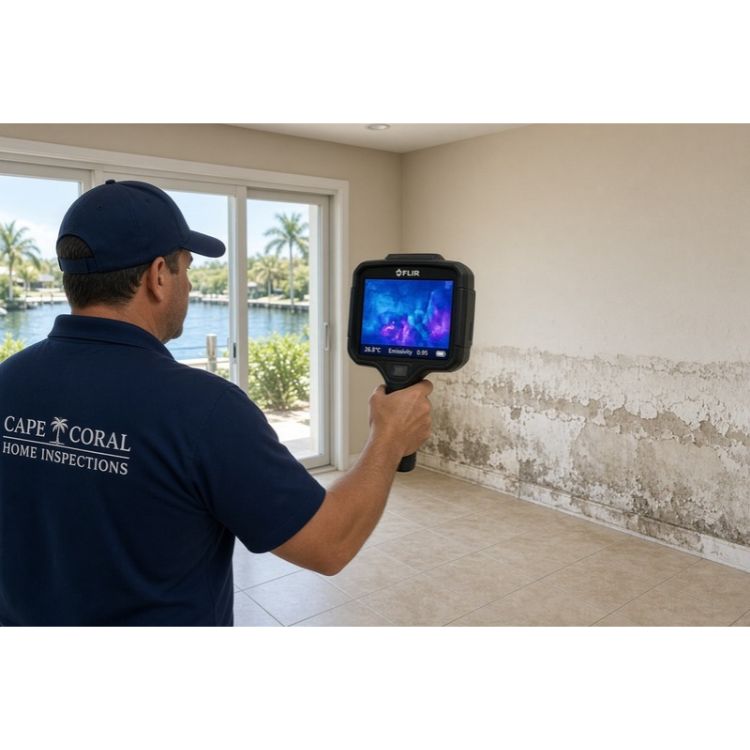
Water that floods a room rarely stays where you can see it. It soaks into drywall, creeps under flooring, fills wall cavities, and saturates insulation. By the time surfaces look dry, moisture can still sit inside materials and create conditions for mold, material failure, and lingering odors. Moisture mapping Cape Coral FL is the process professionals use to measure that hidden water, document its location, and track it until the structure reaches a dry standard.
In Cape Coral the stakes run higher than in many other places. Outdoor humidity often sits between 70 and 90 percent for long stretches of the year. A high water table and extensive canal system mean groundwater pressure and salt-influenced moisture can complicate drying. Storms and aging plumbing add frequent water events. Local restoration work therefore leans heavily on precise moisture mapping for water damage in Cape Coral rather than relying on what the eye can detect.
What Moisture Mapping Means in Practice
Moisture mapping is the systematic measurement and recording of moisture content across building materials after water intrusion. Technicians take instrument readings at defined points, plot them on a floor plan or digital sketch, and produce a spatial record of wet zones, transition areas, and dry reference points.
The IICRC S500 Standard for Professional Water Damage Restoration treats this documentation as essential. It establishes the affected area, guides equipment placement, and creates the baseline used to verify that drying goals have been met. Readings are typically retaken every 24 hours (sometimes more often in the early stages) until materials match the dry standard established for that specific building and material type.
A moisture map is not a photograph of wet spots. It is a data set that shows severity, migration paths, and change over time.
Why Hidden Moisture Creates Secondary Damage
Surface water can be extracted or evaporate within hours. Bound moisture inside materials moves far more slowly. In Cape Coral’s climate that trapped moisture frequently supports mold colonization inside 24 to 48 hours. Wood framing can soften. Subfloors can swell. Flooring finishes can cup or delaminate. Musty odors develop and indoor air quality declines.
A common real-world pattern: a supply-line leak under a kitchen sink saturates the cabinet base and adjacent drywall. The visible water is removed. The wall feels dry to the touch two days later. Moisture readings taken inside the wall cavity and under the cabinet still show elevated levels. Without mapping, those pockets remain and later produce mold or structural issues that cost far more than the original extraction.
Visual inspection alone cannot quantify moisture at depth or confirm that drying is complete. Mapping closes that gap.
How Professionals Actually Locate the Water
The sequence is deliberate.
Technicians first stop the source if possible, assess safety (electrical, structural stability), and identify the likely migration path gravity, capillary action through porous materials, or pressure-driven movement.
They establish dry-standard reference readings on unaffected materials of the same type inside the same building. These become the comparison baseline. Without them, absolute numbers from a meter mean little because materials and local conditions vary.
Non-invasive meters then scan outward from the visible wet zone across walls, floors, and ceilings at consistent intervals often every 12 to 24 inches or in defined grid sections. Elevated readings or thermal anomalies trigger confirmation with pin meters that measure at specific depths.
Air conditions are measured with a thermo-hygrometer (temperature, relative humidity, dew point). These numbers show whether the environment can actually drive evaporation from the materials.
Every reading is recorded with location, instrument type, and value. Photos of meter displays and thermal images are commonly attached. The resulting package directs equipment placement and supports insurance documentation.
In Cape Coral properties extra attention usually goes to slab edges, older plumbing penetrations, cabinet toe-kicks, and areas influenced by groundwater or canal proximity.
Tools and Their Real Limits
Professionals use several instruments because each has clear strengths and weaknesses.
Pin-type moisture meters drive two probes into the material and measure electrical resistance. Wet material conducts electricity more readily, producing a moisture-content percentage. These give the most reliable depth-specific readings for wood and are preferred for final verification. They leave small holes.
Pinless (capacitance or radio-frequency) meters scan below the surface without penetration. They cover large areas quickly and work well on finished drywall and flooring. Readings are relative and must be compared to the dry standard. Dense materials, metal, or foil-faced insulation can interfere with results.
Thermal imaging cameras detect surface temperature differences. Evaporating moisture cools materials, so wet areas often appear cooler on the display. The camera is only a screening tool—it does not measure moisture content. Every temperature anomaly still requires meter confirmation. Insulation voids, air leaks, and sun-heated surfaces can create similar patterns.
Thermo-hygrometers measure ambient temperature and relative humidity. They help determine whether the drying chamber has enough evaporative capacity. In high outdoor humidity environments such as Cape Coral, these readings matter because opening windows can raise indoor moisture rather than lower it.
Used together the tools locate moisture, quantify it, and track progress. Relying on any single method increases the chance of missed pockets or false conclusions.
Where Moisture Commonly Collects
Water follows predictable routes after an intrusion:
Lower sections of drywall and wall cavities through capillary rise
Behind baseboards and shoe molding
Under carpet, pad, vinyl, or tile and into subfloor panels
Inside ceiling insulation after roof or upper-level plumbing leaks
Around pipe penetrations, under cabinets, and behind appliances
Along slab edges and foundation transitions, especially where groundwater pressure exists
Cape Coral’s canal system and seasonal water-table changes can introduce moisture from below or alter migration patterns compared with inland properties. Salt content from storm or tidal influence can also affect drying behavior in some cases.
Building and Updating the Moisture Map
Technicians create a floor plan of the affected rooms and label walls, floors, and ceilings by zone. Readings are taken at consistent heights (baseboard, mid-wall, near ceiling) and across floor grids. Each entry records the instrument, value, and exact location.
Wet zones are marked clearly. Dry reference points remain visible for comparison. Photos of meter screens and thermal images accompany the data. Software platforms often link readings, images, and floor plans into one exportable report.
As drying continues, the same points are re-measured. The map therefore shows trajectory whether a zone is improving, stalled, or expanding rather than a static snapshot. Stalled zones trigger investigation: insufficient airflow, closed cavities that need opening, or equipment that needs repositioning.
Monitoring While Drying Is Underway
Equipment placement follows the map. Air movers increase surface evaporation. Commercial dehumidifiers (often low-grain refrigerant units selected for high-humidity performance) remove moisture from the air. Containment isolates the drying chamber when needed.
Daily re-mapping confirms progress and detects any secondary migration into previously dry areas. When readings reach the established dry standard across the affected materials, equipment is reduced and final verification readings are taken and documented.
This repeated measurement separates controlled structural drying from simply running fans until surfaces feel dry by hand.
Tools and What Each One Actually Does
Professionals carry more than one instrument because each has clear strengths and limits.
Pin-type moisture meters drive two probes into the material and measure electrical resistance. Wet material conducts electricity more readily, producing a higher moisture-content percentage. These meters give the most reliable depth-specific readings for wood and are preferred for final verification. They leave small holes.
Pinless (capacitance or radio-frequency) meters scan below the surface without penetration. They cover larger areas quickly and work well on finished drywall and flooring. Readings are relative and must be compared to the dry standard for that material. Dense materials, metal, or foil-faced insulation can interfere.
Thermal imaging cameras detect surface temperature differences. Evaporating moisture cools materials, so wet areas often appear cooler. The camera is a screening tool only it does not measure moisture content. Every temperature anomaly still requires meter confirmation. Insulation voids, air leaks, and sun-heated surfaces can produce similar patterns, which is why verification matters.
Thermo-hygrometers measure ambient temperature and relative humidity. They help calculate whether the drying chamber has enough evaporative capacity. In high outdoor humidity environments like Cape Coral, these readings are critical because simply opening windows can raise indoor moisture instead of lowering it.
Used in combination, the tools locate moisture, quantify it, and track progress. Relying on a single method increases the chance of missed pockets or false conclusions.
Where Moisture Commonly Hides
Water follows predictable routes:
Lower drywall and wall cavities through capillary rise
Behind baseboards and shoe molding
Under carpet, pad, vinyl, or tile and into subfloor panels
Inside ceiling insulation after roof or plumbing leaks above
Around pipe penetrations, under cabinets, and behind appliances
Along slab edges and foundation transitions, especially where groundwater pressure is present
Cape Coral’s canal density and seasonal water-table fluctuations can introduce moisture from below or alter migration patterns compared with inland properties. Salt content from storm or tidal influence can also affect drying behavior in some cases.
Creating and Updating the Moisture Map
Technicians sketch or generate a floor plan of the affected rooms and label walls, floors, and ceilings by zone. Readings are taken at consistent heights (baseboard, mid-wall, near ceiling) and across floor grids. Each entry records the instrument, value, and exact location.
Wet zones are marked clearly. Dry reference points stay visible for comparison. Photos of meter screens and thermal images accompany the data. Software platforms increasingly link readings, images, and floor plans into a single exportable report.
As drying proceeds, the same points are re-measured. The map therefore shows trajectory whether a zone is improving, stalled, or expanding rather than a static snapshot. Stalled zones prompt investigation: insufficient airflow, closed cavities that need opening, or equipment that needs repositioning.
Monitoring During Active Drying
Equipment placement follows the map. Air movers increase surface evaporation. Commercial dehumidifiers (frequently low-grain refrigerant units chosen for high-humidity performance) remove moisture from the air. Containment isolates the drying chamber when needed.
Daily re-mapping confirms progress and detects any secondary migration into previously dry areas. When readings reach the established dry standard across the affected materials, equipment is reduced and final verification readings are taken and documented.
This repeated measurement is what distinguishes controlled structural drying from simply running fans until surfaces feel dry to the hand.
Determining When Materials Are Dry
An area is considered dry when instrument readings match or fall within an accepted range of the dry-standard reference for the same material in the same building. Surface appearance and touch are insufficient. Final checks usually include pin-meter readings at the previously wettest locations, supporting psychrometric data, and an updated map.
Leaving materials above target levels risks mold growth and continued degradation. Those risks rise in Cape Coral’s climate because elevated outdoor humidity can slow residual drying and support microbial activity once moisture is present.
Moisture Mapping Versus Visual Inspection Alone
A visual walk-through identifies standing water, stains, and soft materials. It cannot measure moisture inside assemblies or prove that drying goals have been reached. Mapping supplies the quantitative record and the progress tracking. The two methods complement each other: visual clues indicate where to begin scanning; instruments reveal depth and extent.
Projects that stop at visual clearance are the ones most likely to produce secondary damage weeks later.
When Professional Mapping Becomes Necessary
Call for professional assessment as soon as standing water appears, a leak is discovered, musty odors develop after a water event, or there is any reason to suspect water has entered walls or floors. In Cape Coral the combination of heat and humidity compresses the safe window before mold risk increases.
Trained technicians bring calibrated instruments, the mapping protocol, properly sized drying equipment, and documentation that insurance carriers typically require. Consumer moisture meters sold at hardware stores lack the calibration range, depth capability, and interpretive experience needed for reliable structural decisions.
Local Factors That Shape Mapping in Cape Coral
High outdoor relative humidity means open-window drying is often counterproductive. Canal proximity and groundwater pressure can influence slab and lower-wall moisture behavior. Storm water may carry contamination that changes the category of the loss and the required protocols. Older homes with certain slab or plumbing details present additional migration paths.
Experienced local teams factor these conditions into dry-standard selection, equipment choice, and monitoring frequency. The measurement principles remain consistent; the environmental context does not.
Moisture mapping converts an invisible problem into measurable data. It defines the true extent of water intrusion, directs efficient drying, and produces the records needed to confirm completion. When water enters a Cape Coral property, that documented process is the most reliable way to protect the structure and avoid the higher costs that follow incomplete drying.
Frequently Asked Questions
How long does moisture mapping take?
Initial mapping of a typical residential loss usually takes 30–90 minutes depending on the size of the affected area and the number of materials involved. Daily re-checks are much faster once the points are established.
Can I do moisture mapping myself with a store-bought meter?
Consumer meters can give rough indications on accessible surfaces, but they lack the calibration, depth range, and reference protocols needed for structural decisions. They also cannot produce the documented map insurers and professionals require.
Does thermal imaging alone prove there is moisture?
No. Thermal cameras detect temperature differences, not moisture content. Cool spots must always be confirmed with a moisture meter because insulation gaps, air leaks, and surface heating can create similar patterns.
What moisture reading is considered dry?
There is no universal number. Professionals compare readings to a dry-standard reference taken from unaffected material of the same type in the same building. For wood, values above roughly 19% moisture content are generally considered elevated and capable of supporting fungal growth, but final clearance always depends on the established baseline.
Why is moisture mapping especially important in Cape Coral?
High year-round humidity, a high water table, and canal-influenced groundwater slow natural drying and increase mold risk. Mapping ensures hidden moisture is found and verified dry before equipment is removed.
Moisture mapping turns an invisible problem into measurable data. It defines the true extent of water intrusion, directs efficient drying, and produces the records needed to confirm completion. When water enters a Cape Coral property, that documented process remains the most reliable way to protect the structure and avoid the higher costs that follow incomplete drying.